Company News
Europe & Middle East Air Market Monthly Report
Executive Summary
1. In August, the Europe and Middle East air cargo markets showed a “weak volume, firm price” pattern, with demand recovering for the first time since early June — signaling that the downturn may be bottoming out.
2. Rates were broadly flat but remained elevated. Yitongda International’s actual transaction data show Europe-bound rates generally fell back except for direct FRA services, consistent with weakening European import demand.
3. The Middle East capacity gap remains a structural constraint, with Gulf-region capacity still about 17% below pre-war levels.
4. European hubs suffered widespread delays, driven not only by geopolitical airspace restrictions over the Middle East but also by strikes, air traffic control failures, summer storms and staffing shortfalls within Europe.
5. September rates are expected to keep oscillating at high levels, while volumes continue to stabilize on a low base.
Core Data Snapshot
In August, the Europe & Middle East air cargo market as a whole showed a pattern of “weak volumes, stable prices and regional divergence”. The overall picture across four dimensions:
· Rates: In a range of “month-on-month stabilization at high year-on-year levels”. By contrast, Yitongda International’s actual bookings: Shanghai-origin direct FRA rose MoM (+6.5%), all other lanes generally retreated, and the three Middle East lanes fell 10.3%–11.0% MoM.
· Demand: The first monthly recovery since early June, showing bottoming signals; Middle East-to-US cargo value +25%, while volumes to Europe −6%.
· Capacity: European network capacity +3.0% YoY, though widespread delays occurred; Gulf-region capacity remains 16%–17% below pre-war levels.
· Load factor: European carriers CTK +4.4%, CLF 51.1% (highest globally); Middle East carriers CTK +1.7%, CLF 44.1%.
The August air freight index was “broadly flat and soft”; the moves can be summarized as follows:
· Europe lanes stayed weak while FRA rose against the trend: July Europe-lane rates had already dropped about −8.8% MoM; in August all lanes except direct FRA continued to ease or held flat — a continuation of the trend, with only a structural rebound.
—— Seasonally, August remains peak summer travel season; the recovery of belly capacity kept Europe-lane supply loose and the supply-demand balance unreversed.
—— On policy and trade demand, following the EU’s removal of the low-value import duty exemption in July, e-commerce parcel volumes plunged, with no demand-side repair in sight.
· Middle East rates kept retreating from highs: July already showed a “high-then-low” profile with monthly averages of roughly −10% to −15% MoM; August fell a further −10.3% to −11.0%.
—— The Middle East capacity gap narrowed versus July, adjusting to −16% to −17% in August; the recovery pace improved at the margin but remains a structural constraint.
· Fuel costs reversed year-on-year and kept rising month-on-month:
—— July +15.2% MoM / −9.1% YoY; August +8.2% MoM / +74.2% YoY. Cost-side pressure increased markedly versus July, providing floor support for September rates.
|
Indicator |
August Performance |
MoM |
YoY |
|
Europe lane rate |
~US$4.14/kg |
−7.8% |
+13% |
|
Europe regional volume |
−8% |
+1% |
−8% |
|
Middle East regional volume |
+25% |
−1% |
+25% |
|
Europe capacity |
Ample; hubs disrupted by delays |
Disrupted by strikes / ATC |
Network capacity +3.0% YoY |
|
Middle East capacity |
Gap 16%–17% |
Mild weekly fluctuation |
— |
|
Jet fuel price |
~US$160/barrel |
+8.2% |
+74.2% |
GUSC - Average Actual Booking Rates
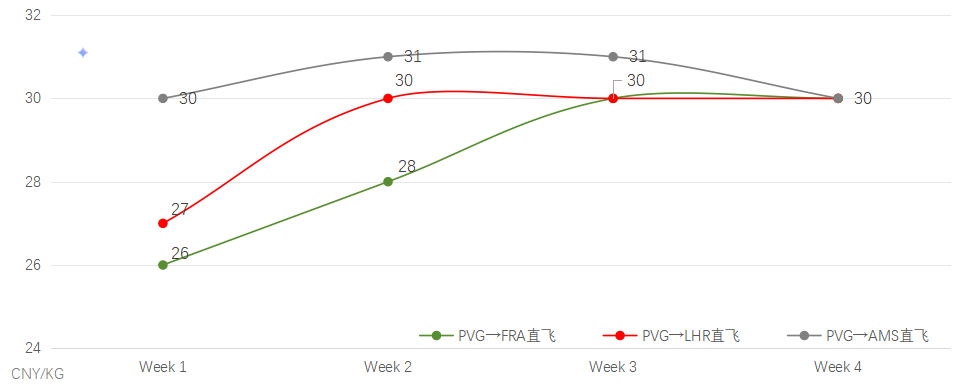
On Europe lanes, PVG-origin rates showed a pattern of “FRA direct rising alone while the rest broadly eased”. FRA direct averaged CNY 28.5/kg in August, up 6.5% from July — the only rising Europe lane; LHR direct, AMS direct and several transit lanes declined MoM, with MXP transit (−20.8%) and MAD transit (−16.5%) posting the steepest drops.
Figure 1 · GUSC— actual transacted average rates on key Europe-bound lanes from PVG, August 2026
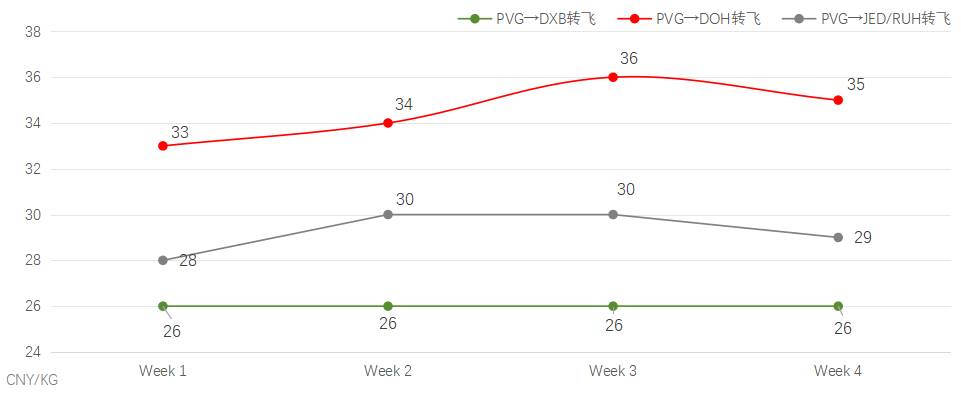
On Middle East lanes, DOH transit averaged CNY 34.5/kg, still the highest across all lanes; DXB transit held relatively steady at CNY 26.0/kg; the three Middle East lanes fell 10.3%–11.0% MoM, showing that despite the persisting capacity gap, spot prices have retreated from their April highs.
Figure 2 · GUSC— actual transacted average rates on key Middle East-bound lanes from PVG, August 2026
August Capacity Dynamics
European hub operations were anything but smooth
Four large-scale disruption events were recorded in August, affecting more than 9,500 flights in total. Beyond geopolitical airspace restrictions over the Middle East, strikes, air traffic control (ATC) failures, summer storms and staffing shortfalls within Europe drove the hub delays.
|
Date |
Event |
Flights Affected |
|
Aug 11 |
Barcelona strike + storm |
~2,400 flights (AMS/FRA/LHR affected) |
|
Aug 25 |
Rome and 12 other airports (13 in total) |
1,946 flights (1,871 delayed + 75 canceled) |
|
Aug 29 |
UK NATS ATC failure + jet fuel supply |
2,100+ flights |
|
Aug 30 |
London and 15 European airports |
2,994 flights (2,911 delayed + 83 canceled) (LHR/LGW/LTN/CDG/AMS/FRA/MAD/BCN/DUB) |
Recovery progress of the three major Middle East carriers
|
Carrier |
August Recovery Status |
|
Emirates |
140 destinations / 72 countries (98% of network); capacity restored to 93% of the pre-war level; carried ~8.7 million passengers in Jul–Aug |
|
Qatar Airways |
160+ destinations (85% of pre-war network); resumed Doha→Bahrain / Kuwait / Erbil on Aug 8 |
|
Etihad |
The only carrier with positive YoY capacity growth in August (+9%; Emirates flights −12%, Qatar −16% over the same period); inaugural Abu Dhabi–Tashkent flight on Aug 9 |
Airspace security and geopolitical risks
|
Area Covered |
Restriction Level |
Details |
|
Persian Gulf waters (Bahrain / Kuwait / Qatar / UAE, four FIRs) |
No operations permitted |
Except as required for take-off and landing at airports within the affected FIRs |
|
Gulf of Oman (Muscat FIR, waters west of 58°E) |
No operations permitted |
Applies to all altitudes and flight levels |
|
Airspace over the territory of affected countries |
Mandatory caution |
Continuous risk assessment and contingency plans required |
Geopolitical conflict reignited in late August: the US strike on rocket-launcher sites on Iran’s Larak Island on August 30 (the first direct action in over a month) and Iran’s launch of eight ballistic missiles toward Jordan on August 31, among other events, led to restricted or even prohibited operations across multiple regions.
August Demand: A Three-Way Pattern of “Europe Under Pressure, Middle East Diverging, Intra-Asia Resilient”
|
Flow |
YoY Performance |
|
Mainland China → Europe |
−8% (W33 −5%, decline widening) |
|
Hong Kong → Europe |
−33% (W33 −35%, decline narrowing) |
|
Mainland China + Hong Kong → Europe |
+1% WoW (first recovery since early June) |
|
Intra-Asia |
+6.1% (33 consecutive months of growth) |
|
Europe → Asia |
+3.1% (41 consecutive months of growth) |
|
Europe → Middle East |
−16.1% (5 consecutive months of decline) |
|
Middle East → Asia |
−14.1% |
Policy Impacts on Air Cargo in August
|
Policy Event |
Timing |
Impact |
Direction |
|
EU removal of the low-value import duty exemption |
Effective July 1, 2026 |
Mainland China → Europe volumes −8% YoY; Hong Kong → Europe −33%; low-value e-commerce hit further in August |
Negative for volumes |
|
EU interim flat-rate customs duty |
Expected to advance within 2026 |
Raises cost and handling complexity for low-value parcels |
Negative for volumes |
|
Renewed Persian Gulf conflict |
Late August |
Airspace restrictions persist; rerouting extends distance and raises cost |
Negative for capacity |
|
US removal of de minimis |
May 2025 (China / HK); August 2025 (global) |
China e-commerce to US already +23% in July 2026; US-lane volumes recovering |
Positive for US lanes |
September Outlook
Rates are expected to keep “oscillating at high levels with slight month-on-month pressure”:
· Europe lanes: YoY still at a high of 15%–20%; MoM slightly pressured by the tail of peak season and soft volumes — forecast −3% to +2%.
· Middle East lanes: the capacity gap is expected to narrow from 16%–17% to 12%–15%; the geopolitical premium keeps rates at relatively high levels. Should Strait of Hormuz transit be disrupted, one-sided upside risk exists.
· Cost side: the global average jet fuel price jumped to about US$171/barrel in early September; costs pass through into September, providing floor support.
News Category
News Center
Contact Us
Name: Marketing
Phone: (+86) 16620010324
Email: marking@globalunited.com.cn
Address: Unit I, 7/F, Guang Hai Tower, No. 308 BinJiang Zhong Road, Haizhu District, Guangzhou, China